


Forecasting, Reimagined
As the sole designer at Winmore India Pvt Ltd, I collaborated closely with leadership, product managers, and engineers to design AI-powered logistics products from the ground up, creating intuitive enterprise experiences that simplified complex freight, pricing, and operational workflows for global transportation teams.
Senior UX Designer
ROLE
0 → 1 Product Design
SCOPE
3-4 MONTHS
TIMELINE


Forecast Intelligence Platform
Transforming forecasting from reporting to decision-making
A forecasting intelligence platform designed for logistics teams handling high-volume operational planning across fragmented systems and disconnected forecasting workflows.
As the sole designer, I led the experience end-to-end — from product structure and workflows to dashboard systems, operational visibility, and scalable forecasting interactions.
Forecasting workflows relied heavily on spreadsheets, static reports, and disconnected operational systems.
Teams spent more time:
Comparing numbers
Identifying inconsistencies
Manually tracking trends
Than actually making decisions.


Forecasting shouldn’t rely on guesswork, Operational decisions need more than spreadsheets
Manual forecasting inputs
Manual forecasting inputs
No real-time operational visibility
No real-time operational visibility
Disconnected data tracking
Difficult to compare trends
Even with forecasting data available, users still relied on intuition because:
Nothing felt prioritized
Operational risks weren’t surfaced
Trends were difficult to interpret quickly
The system generated information, but not confidence.
Designing for operational awareness.
Instead of creating another reporting dashboard, I redesigned forecasting around moments of operational decision-making.
The platform was structured to help users identify what changed, investigate forecasting gaps, act faster with confidence

Visibility before complexity
The dashboard experience focused on creating immediate operational visibility through high-level metrics, forecast vs actual tracking, and real-time alerts and anomaly detection, enabling teams to identify forecasting gaps and operational risks faster. The experience was designed to reduce manual analysis and fragmented reporting by surfacing critical insights upfront, helping operations teams make faster, data-driven decisions with greater confidence and efficiency.

Data Forecasts
The forecasting workflow was designed to help planners manage large operational datasets with greater flexibility and clarity through editable forecasting structures, simplified workflows, scalable table systems, and faster operational updates, enabling more efficient planning and decision-making.

Performance Breakdown
The performance layer helped teams investigate forecasting gaps through forecast vs actual comparisons, trend visibility, variance analysis, and contextual operational data, enabling faster identification of inconsistencies and more informed operational decisions.

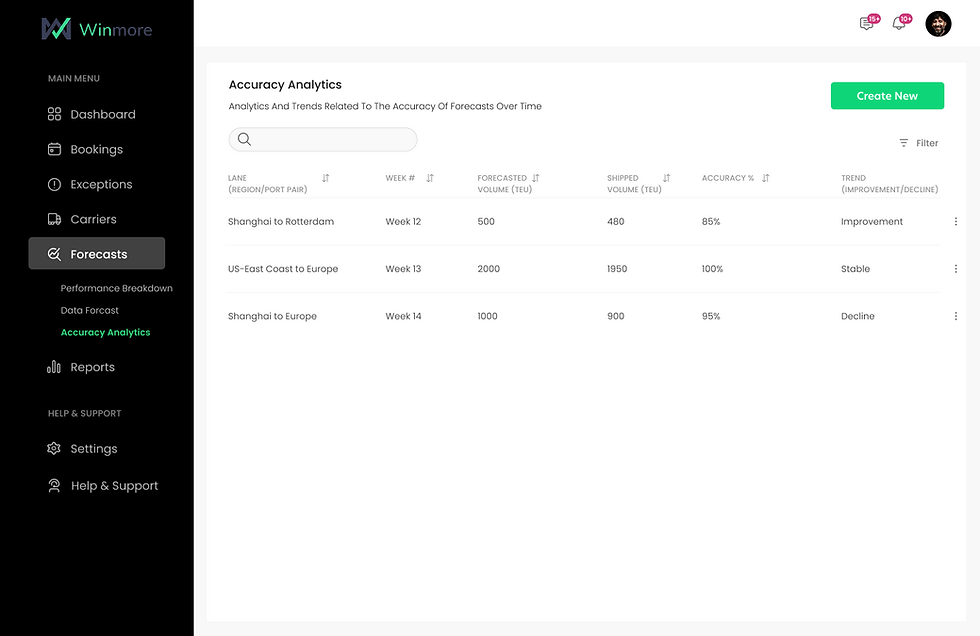
Accuracy Analysis
The analytics experience focused on improving long-term forecasting reliability and operational performance by enabling teams to monitor forecasting accuracy, recurring variances, operational consistency, and long-term performance trends for more informed decision-making.
Impact
Next case study
Improved operational workflow efficiency by 35%
Reduced usability issues by 25% through simplified workflows and clearer operational visibility
Became one of the most positively received internal operational tools among planning and operations teams due to its real-time visibility, structured forecasting workflows, and ease of use
